
COURT CONDITIONS • EXPERIENCE
Adventures in Drift Charting
What happened when detailed prepared drift charts worked brilliantly—until changing courts, discs, and conditions changed the lesson.
Why I Started Charting
When I first learned and integrated drift charts into my play, I experienced a tremendous boost in accuracy of my shots. I spent many, many hours charting the courts of the three clubs where I play the most, developing sets of charts covering most of the courts for each location. Now I hardly use those charts when I play a match. Can you guess the reasons why?
Drift charts are a map of the way the contours of a court affect moving discs. They chart the path that shot discs follow as they move across the rises, valleys, bumps and divots of the surface of a court. They don’t show the actual contours of the court, but rather the effects on the discs of those contours.
There are many factors that affect how a disc moves across the court in addition to drift: weight and composition of the disc; the wax application to the disc; the wax or other surface application to the court; the composition, shape, spread and density of the court beads; the composition and the surface smoothness of the court; dust, dirt, debris or moisture on the court; variations in the paint on the court surface; chips and other surface anomalies of the bottom of the disc; shape of the bottom of the disc (they are supposed to be conditioned when new to ensure they are completely flat, but often this is not done properly or at all); spin or other effects imparted by the shooter; environmental humidity, temperature, wind and precipitation. Many of these factors change over the course of a game or match. All these together make the accuracy of every shot a challenge, requiring adjustments to starting position of the disc, aim and speed of delivery, and sometimes to selection of an appropriate cue or adjustments to the cue head. And each game or court will present its own unique court and disc characteristics. The adjustments that the player must make to account specifically for the drift of the court affect only two factors of delivery – starting position of the disc and aim.
Building My System
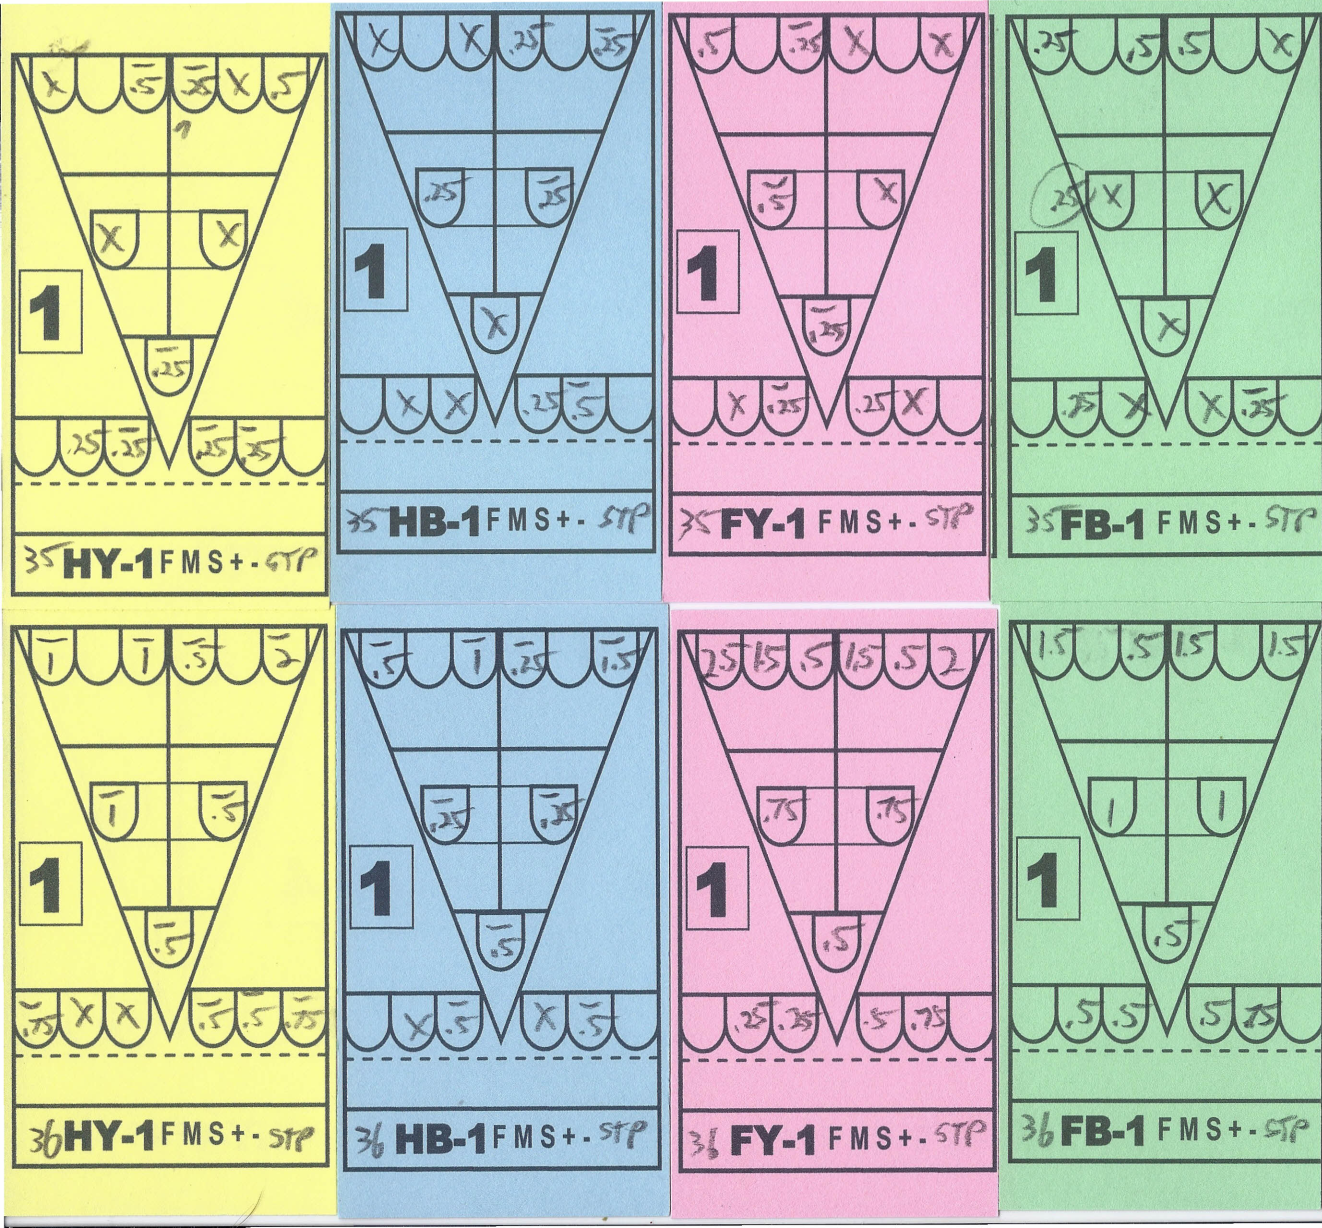
When I first decided to give drift charts a go, I looked to find out what I could about how the pro players do it. There are many different methods and many different chart designs, often unique to individual players. The markings on a chart mostly consist of either lines or arrows that represent the path that discs take down the court, or marks that show the distance that the cue disc will land from a target location on the court. I wasn’t happy with either and developed my own chart design and marking method, recording by a number system the distance left or right from a target location that my cue disc will land when shooting directly for the target: the number corresponding to the width of a disc. If I write “1” on the middle eight spot on my drift chart, that means my cue disc drifts the width of one disc (6 inches) to the right when shot directly at that spot; “-1” means the width of one disc to the left; “.5” means the width of half a disc (3 inches); etc. going as accurate as a quarter-disc (“.25”; “1.25” and such). My charts have circles printed on and above the scoring diagram for sixteen locations on a court: Tampa, St Pete and wide St Pete on each side; the center eights; close to the line next to the center eights; and three across the deep seven on each side. The front of my chart is for shooting from the one position; the back for shooting from the four position. For other spots on the court and other shooting positions, I adjust mentally. Adjustments need to be made for speed of my shot, too – my charts show the drift when I shoot at a speed to arrive exactly at the target spot.
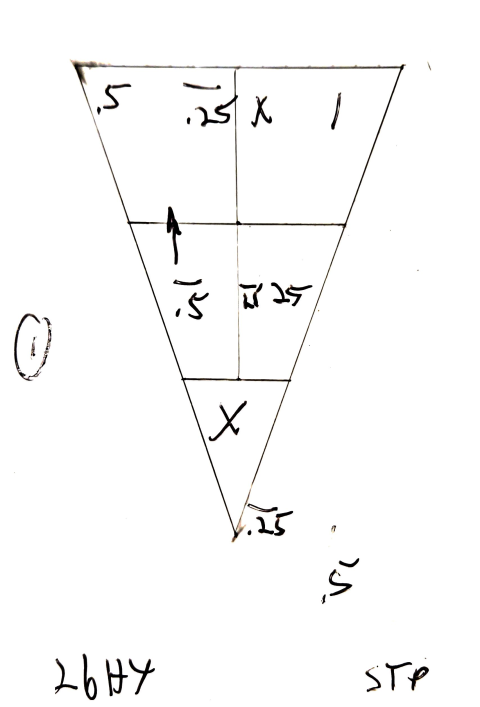
Drift charts are a memory aid. Many players don’t use them. They either have excellent memories, or are deficient to one degree or another in compensating for drift. I find that I need them, especially over the course of a tournament, going from color to color and court to court. When I first began to use them, I showed a great improvement in accuracy and game results. It took about five months of regular use to fully learn how. This slowed my game down, which gave me a reputation as a “slow player”, but it was necessary to really get the hang of it. The results encouraged me to spend the summer charting the courts of my home club and others nearby. This effort paid off the following season of tournament play. The charts worked like a charm, giving me the memory aid I needed for playing the drifts. I also charted on the fly when traveling to other clubs for tournaments, resulting in additional stacks of charts for each club covering the courts I had played, albeit not as fully filled out for all spots.
When Prepared Charts Worked — and When They Didn’t
The next summer I spent a lot of time charting the courts at the St. Pete club in preparation for the ISA in October. But I had to wait for the grinding and repainting of the courts to finish, so only had about six weeks to do charting. I was only able to get about a dozen courts fully charted. I settled for a quick run on another 25 courts or so, gaining only an overall feel for the drift on each (e.g. “yellow court, drifting .5 to 1 towards the east on both colors”), which I recorded on a ‘cheat sheet’.
Going into the next tournament season, I had three index card boxes of my charts, all neatly organized by location and court number. But many of them failed me. The St. Pete club had new sets of tournament discs for the ISA, which were very poorly conditioned and threw off the accuracy of my charts. The Clearwater club also had ground and repainted their courts over the summer, which changed many of the drifts. And even my charts for clubs with consistent court conditions didn’t seem to be accurate other than for an overall sense of the drift tendencies – “yellow court”, “black court”, big drifts in, mild drifts out, and such. Eventually I stopped using my prepared drift charts and started creating a new one on the fly for each game, each time I played, referring to my old charts for the court only before the start of a game for the general read of drift tendencies of the court.
What I Actually Learned
What happened to the accuracy of my prepared charts? Besides the grinding and repainting of the courts, those many other factors affecting the movement of the discs in many cases overshadowed my charts on a particular day. But then how did I gain such great improvement from the use of the charts that first season I used them? Charting on the fly each game was now working well, as good as using my prepared charts had that first season. It finally dawned on me – it wasn’t having the prepared charts that made drift charts effective for me. It was simply that in spending all that time making the prepared charts I had learned the ins and outs of court drifts!
Drift charts are still the great memory aid for me that they have been since I started using them. But now I just refer to my old charts before a game to get the general read of a court I’ve played before, and then I make a new chart on the fly for that game. I am also converting many of my old charts to cheat sheets instead, a descriptive page with a short paragraph of the read of each court. We’ll see how that pans out over the upcoming tournament season.
How do you deal with the court drifts?
First time on your new site and I like it. Just read the drift card article and found it informative. I have never used drift cards but I do test my memory when I do it on the fly.
If I don’t use drift charting, I can lose track, especially late in the day in a tournament. I sometimes find myself playing the drift of a different court that I played earlier in the day.